
![[2026 Update] Median House Prices, 1970-2025... in GOLD](/content/images/size/w1200/2026/03/Houses-in-Gold.png)

Updated March 2026
I wrote the original version of this post in February of 2012, when the housing market was trying to find its bottom. Calculated Risk had just called the bottom on housing. Gold was at $1,569 an ounce. The median existing home cost about 105 ounces of gold.
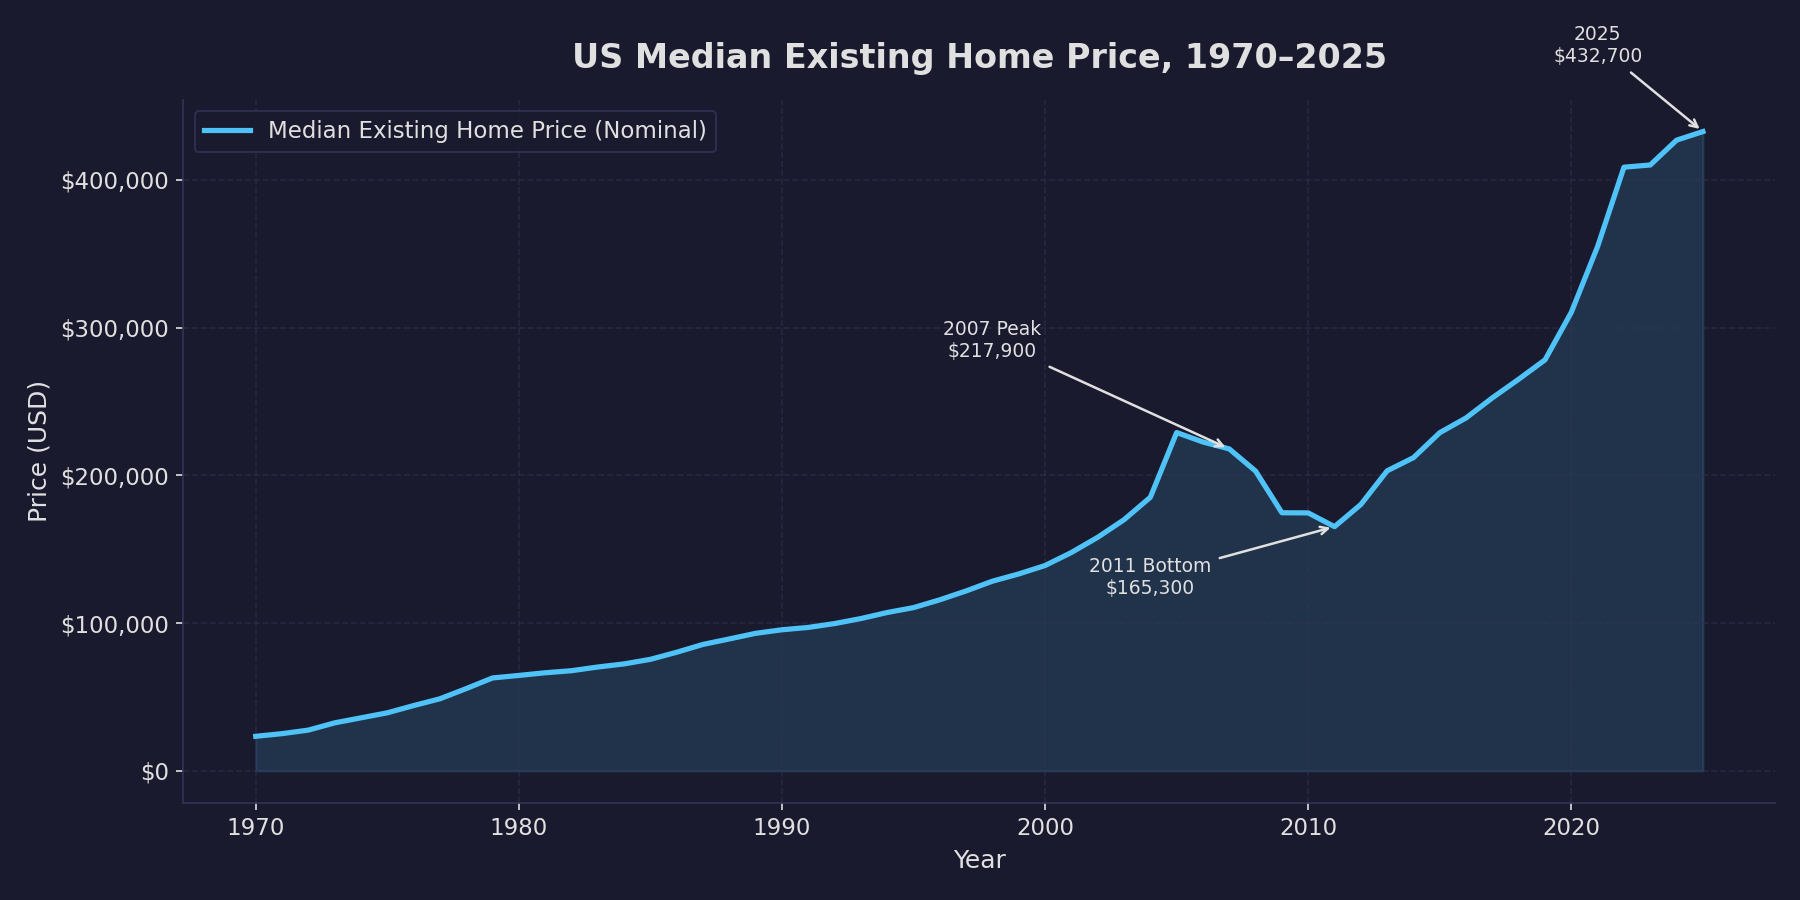
Well, here we are in 2026 after the most insane run up in home prices in recent memory maybe ever. The median existing home price has gone from $165,300 to $432,700 — a 162% increase. Housing affordability is a full blown crisis now.
But... what if you priced homes in gold, as I did back in 2012?
The Charts in 2026
Here's the updated chart, from 1970 through 2025:
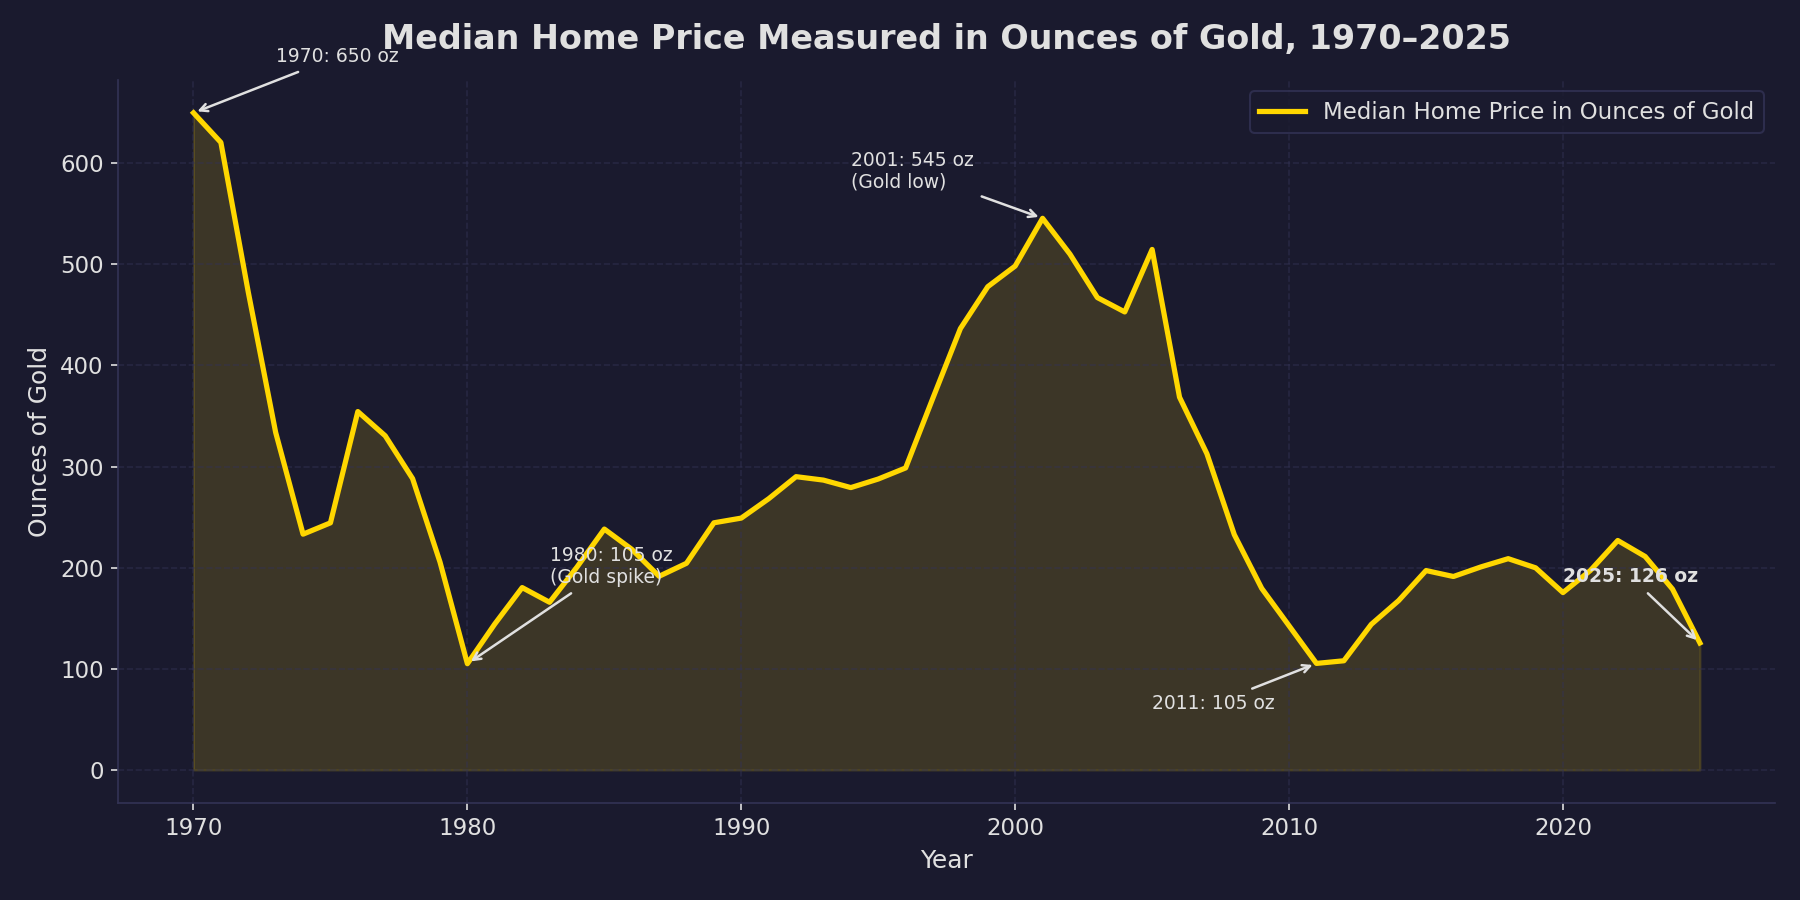
What jumps out immediately is that we are right back in 1980 and 2011 neighborhoods for home prices, if priced in gold.
In 1980, when gold spiked during the inflation crisis, the median home cost about 105 ounces of gold. In 2011, when gold hit $1,569 during the post-financial-crisis era of quantitative easing, the median home cost 105 ounces of gold. And in 2025, with gold above $3,400 an ounce, the median home costs 126 ounces. Sure, that's more, but it's not 162% more.
Furthermore, Gold averaged $3,446/oz in 2025. As I write this in March 2026, it's above $5,000. If it stays there — and the median home price stays around $430K — the median home now costs roughly 86 ounces of gold.
That would mean that homes are as cheap as they have ever been since the data begins in 1970.
Let that sink in.
Meanwhile, look at the nominal price chart — the one NAR puts in every press release:
But the gold chart tells a different story entirely. In gold terms, the American home peaked in value around 2001, when gold was cheap and housing was riding the pre-bubble boom. At that peak, the median home cost 545 ounces of gold. Today it costs 126 ounces. That's a 77% decline in real value.
Put another way: in 2001, the buyer who sold one median-priced home could have bought four median-priced homes with the gold equivalent in 2025. Four.
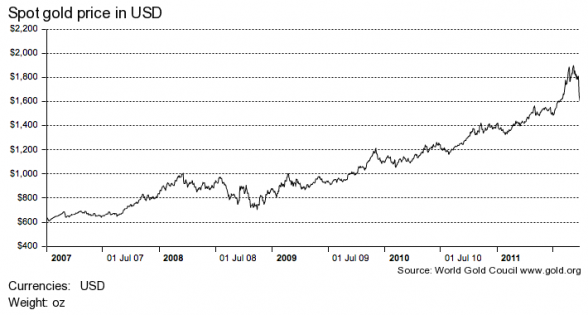
Since I gave you the spot gold price chart in 2012, let me give that to you now as well:
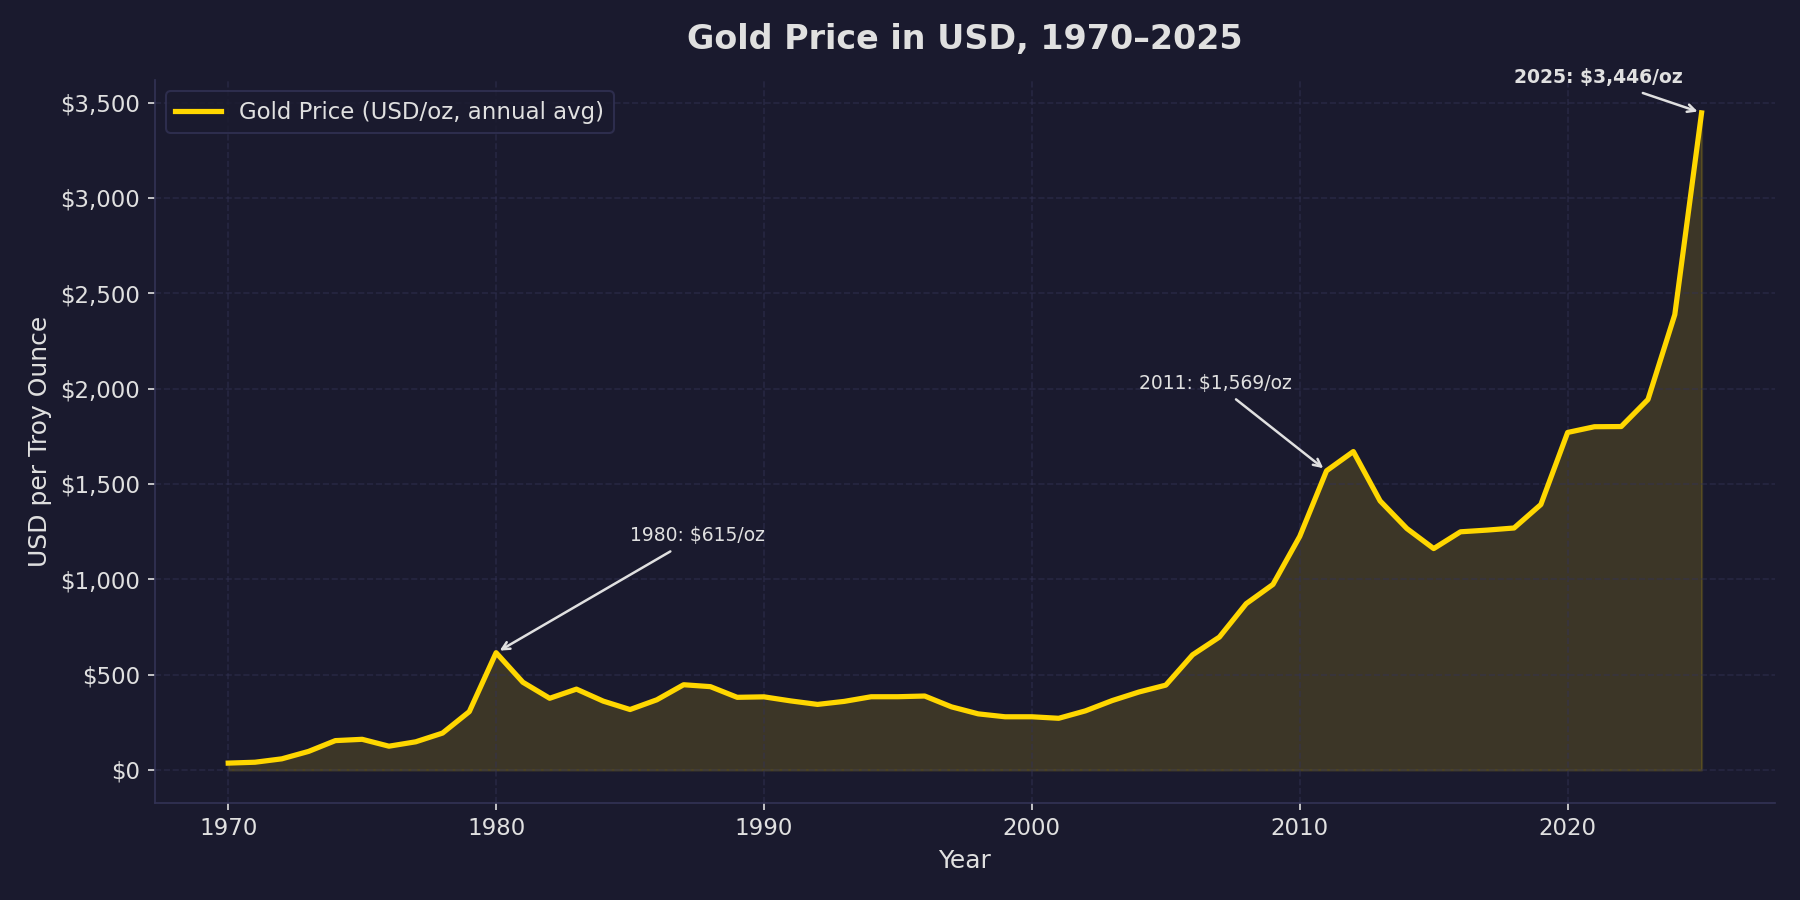
As mentioned above, in March of 2026 as I write this, gold is $5,047 per ounce (Kitco.com). And we're in a war-that-is-not-a-war burning $1 billion per day.
The Post-2011 Story: Recovery until 2022
Here's what happened since I wrote the original post:
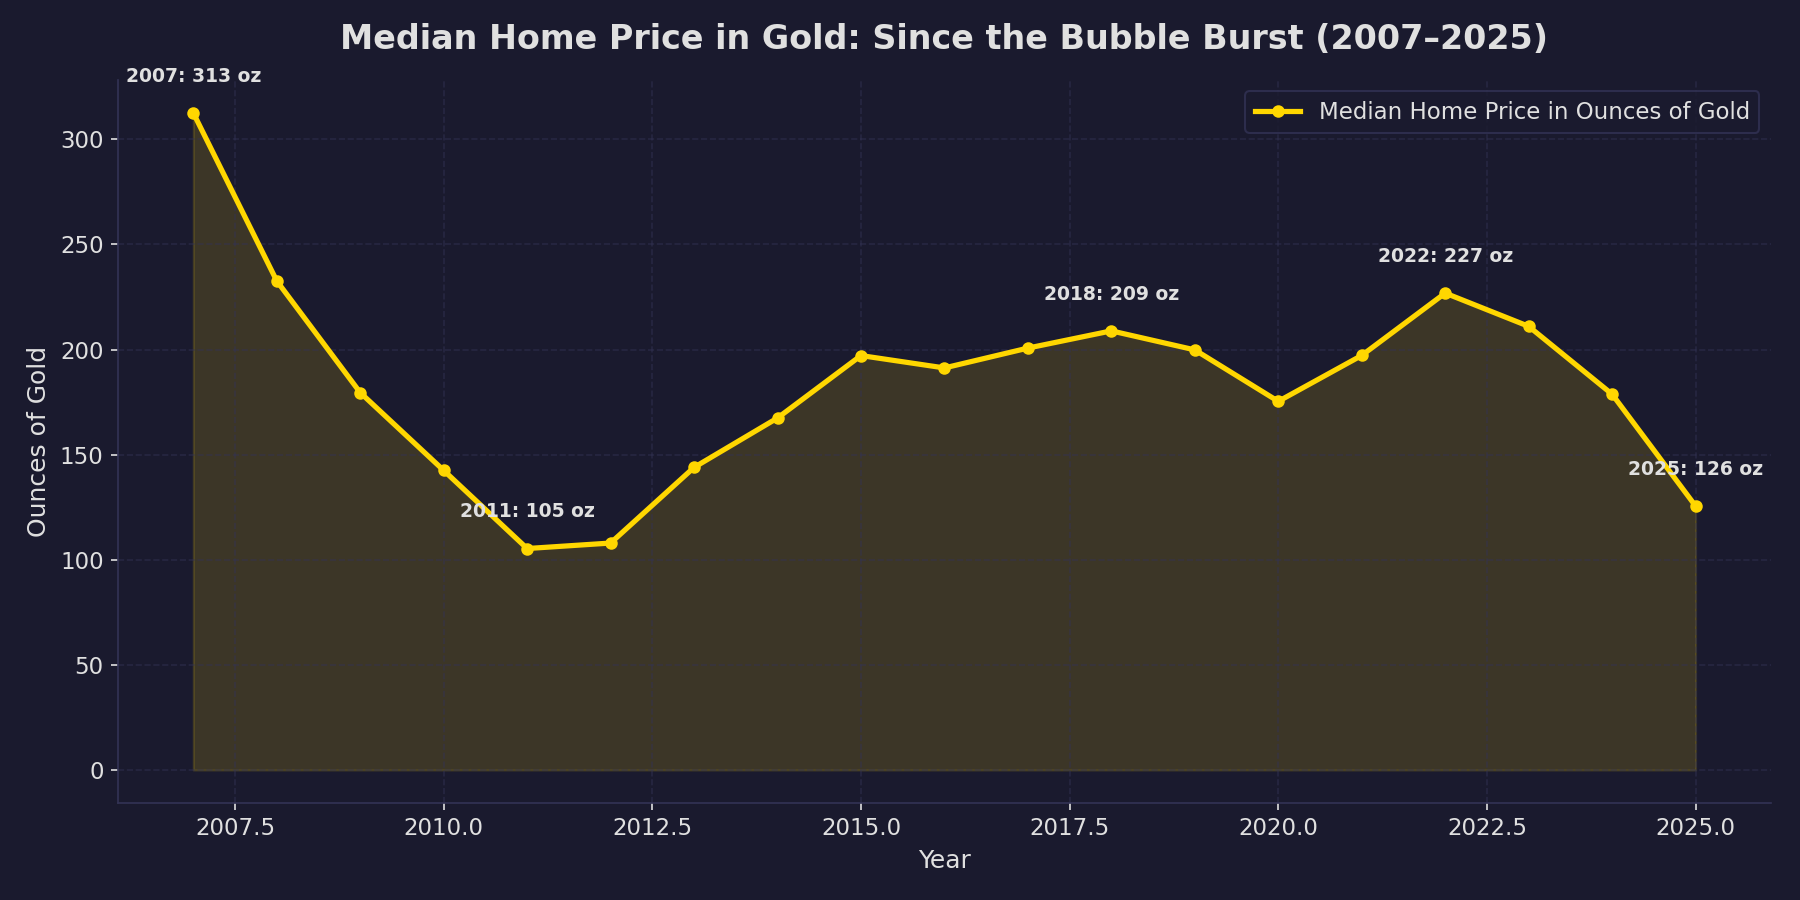
From 2012 to 2022, there was a genuine recovery in home values in terms of gold. The median home went from 108 oz to about 227 oz of gold. Housing was outrunning gold for a decade. The COVID-era price spike plus relatively stable gold prices made homes look like they were recovering real value.
Then 2023-2025 happened. Gold went vertical — from $1,800/oz to $3,446/oz average in 2025. Home prices kept climbing in dollar terms, but they couldn't keep pace with gold. In just three years, the gold-adjusted value of the median home got cut nearly in half, from 227 oz back down to 126 oz.
One might ask why.
I Ain't an Economist... But...
Well, in March of 2022, Powell's Fed raised rates from near-zero to 5.25%-5.50%. It was also raised incredibly fast, with 11 rate hikes in about 16 months. That just sucked all of the momentum out of housing demand.
Thing is, rate hikes are supposed to be bad for gold. Gold pays no yield, so when treasuries are paying 5%, gold becomes less attractive. That's the textbook. But gold went up anyway.
Well, what else happened in 2022? Oh that's right, Russia invaded Ukraine.

In response, the US froze Russia's dollar reserves. Sure, we had done that to Iran in 1979, Libya under Gaddafi, Syria, Syria, Venezuela, and Afghanistan. But this was Russia we're talking about here.
Smart financial people were warning about the consequences at the time. For example, here's Zoltan Poszar in Bloomberg:

Just like he said, every central bank on the planet took note. China, India, Turkey, and dozens of others started buying gold at a pace not seen in decades: over 1,000 tonnes a year, three years running, then 863 tonnes in 2025. They were de-dollarizing in real time.
And now... we're in a not-a-war with Iran, which has shut down the Straits of Hormuz, bombed its oil-producing neighbors, and threatens the petrodollar as well... while we have $36 trillion in debt and spending $1 billion a day in bombing Iran. I suspect my next update will be interesting, to say the least.
Updated Takeaways
My 2012 takeaways hold up pretty well, actually. But let me update them:
First, that "housing recovery" from 2012-2022 was real even in gold terms: from 105 oz to 227 oz. Most of that has already been given back due to dollar devaluation. Based on March 2026 prices, homes have never been cheaper. The problem, of course, is that Americans have never been poorer. I didn't even get into wages-in-gold, but that can be found on the internet. You don't need to if you have been to a gas station or a grocery store recently.
Second, the gold/housing ratio suggests that either (a) gold is massively overvalued (although central banks keep hoovering it up), (b) housing is significantly undervalued (maybe but young people are pissed off that they can't buy a house), or (c) the dollar has lost enormous purchasing power. I'll go with C.
Third, I wrote in 2012 that "now might not be the time to be bargain hunting as a buyer, since your cash is continuing to lose value." I stand by that since the USD has lost about 42% of its value since then. The house you bought gained about 19% in gold terms, so the gain is real. As of March of 2026, houses have not been cheaper in gold terms; maybe that means you buy gold instead of houses? But you can't live in gold bricks and your dollars keep bleeding value every day. Choices, choices.
We have to see how 2026 plays out, I suppose, but on current trends, overpaying for a house today in USD might make sense depending on your situation. No, for real, ask your grandpa, can I have his hand me down house?
Selling a house? I'll take gold or BTC for mine, thanks.
-rsh
Original 2012 Post
I've seen quite a few posts of late suggesting that the housing market has finally hit bottom. Agent friends of mine are telling me about increased activity in their local markets, multiple bids on houses, low inventory, and so on. We have Stan Humphries of Zillow saying the Spring 2012 season should be positive. And none other than Calculated Risk, hardly a cheerleader for housing, has called the bottom on housing:
And it now appears we can look for the bottom in prices. My guess is that nominal house prices, using the national repeat sales indexes and not seasonally adjusted, will bottom in March 2012.
...
There are several reasons I think that house prices are close to a bottom. First prices are close to normal looking at the price-to-rent ratio and real prices (especially if prices fall another 4% to 5% NSA between the November Case-Shiller report and the March report). Second the large decline in listed inventory means less downward pressure on house prices, and third, I think that several policy initiatives will lessen the pressure from distressed sales (the probable mortgage settlement, the HARP refinance program, and more).
I'm working on the Redfin 3.0 post, but this was interesting enough that I took a short break from that to run some quick numbers. Maybe all these green shoots of positivity will indeed result in the housing market finally turning around. For a variety of reasons, I'm skeptical of such a thing, but I could be and hope to be wrong.
What I wondered about is whether this increase in housing activity, increase in prices, were actually just a reflection of higher inflation and inflation expectations. Well, there might be a way to measure that...
Enter GOLD!
Gold, the Ultimate Holder of Value
My inspiration for this came from this post on Forbes about oil prices:
As this is written, West Texas Intermediate crude oil (WTI) is trading at $105.88/bbl. All this means is that the market value of a barrel of WTI is 105.88 times the market value of “the dollar”. It is also true that WTI is trading at €79.95/bbl, ¥8,439.69/barrel, and £67.13/bbl. In all of these cases, the market value of WTI is the same. What is different in each case is the value of the monetary unit (euros, yen, and British pounds, respectively) being used to calculate the ratio that expresses the price.
In terms of judging whether the price of WTI is high or low, here is the price that truly matters: 0.0602 ounces of gold per barrel (which can be written as Au0.0602/bbl). What this number means is that, right now, a barrel of WTI has the same market value as 0.0602 ounces of gold.
...
Over the centuries, gold has been “the golden constant”. Eventually, all prices equilibrate with gold. This is why gold represents the best available standard in terms of which to define the value of a monetary unit. Forty-one years ago, when the value of the dollar was defined in terms of gold at $35/oz, WTI was selling for $3.56/bbl.
What I wanted to do was the apply the same logic to housing.
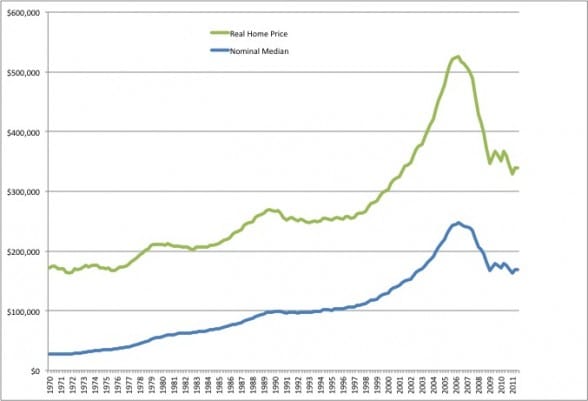
Housing Prices, Since 1970
So I went and found some data on median housing prices from 1970 (when the median price of a single family house was $26,986) through Q3 of 2011 (when the median price was $169,500). Then I also found some data that figured out the Real Price, correcting for some inflation (CPI). What we have from that data is this:
I then found gold prices in USD for the same period, and calculated how many ounces of gold one would have had to pay for the median priced home from 1970 to 2011. Here's that graph:
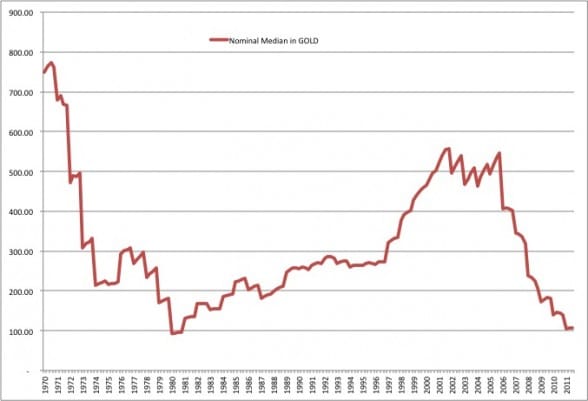
Sort of different eh?
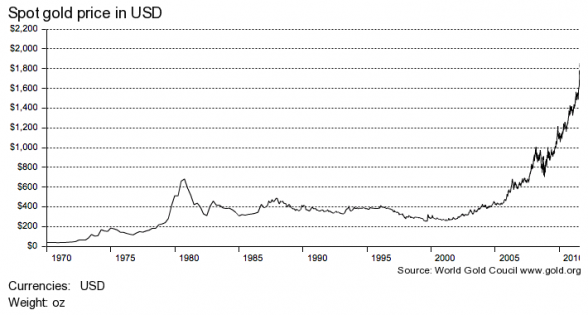
And a final graph -- price of Gold in USD since 1970:
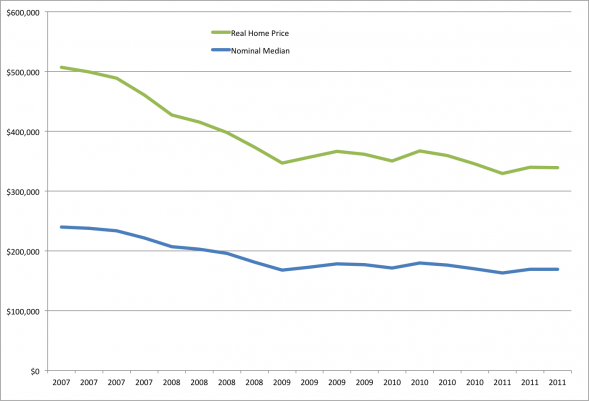
What About Since the Bubble Burst?
If we say that the Bubble burst in 2007 -- although most people agree it started sometime in late 2006, or earlier, the price effects might not have shown up until 2007 -- and we draw the above charts, they look like this:
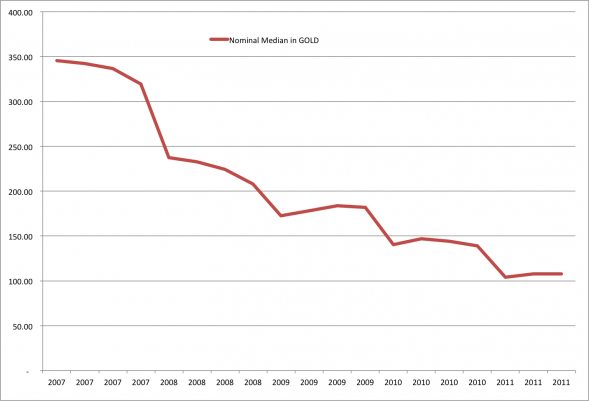
Calling Dr. Yun
This is where I need someone far better at economics. I'll take an amateur stab at what to make of this, but please, correct me as I'm sure to be wrong.
The most obvious thing is that if you price homes in gold, the home values in 2011 are almost at the lows of 1980. In 1980, the median priced home in the US cost 92.41 oz of gold; in 2011, the median priced home cost 103.84 oz of gold.
The second glaring thing is that if you price homes in gold, housing has taken a far bigger hit than we perhaps have realized until now. In 2007, when the Bubble burst, the median house cost 345.52 oz of gold; in 2011, the median house costs only 107.86 oz of gold. But the Real and Nominal price graphs, denominated in USD, are showing far smaller albeit still painful declines. The Real Price, adjusting for CPI, of the median priced house went from about $266K in 2007 to $167K in 2011.
But in gold terms, the loss was more than 2/3 of the value of the house. For the same price paid for one median priced home in 2007, the buyer in 2011 can purchase three median priced homes... and still have some gold left over. That is an astonishing loss of value.
Third, strength of gold prices means the weakness of the dollar. It's almost the textbook definition of currency devaluation. For housing prices to recover, the price gains would have to outpace the rise in gold prices... or gold prices must drop, which means that the dollar is getting stronger.
With another trillion-dollar-plus deficit in the 2012 budget, and some $16 trillion in national debt, it seems unlikely that we'd see a real rally in USD anytime soon. It isn't clear to me that the Fed could turn off the printing presses now, even if it wanted to do so.
Finally, it may be that the "Real Price" of housing is seriously flawed in some way... or in the alternative, that gold is extremely overvalued right now. There are arguments on both sides: the CPI excludes some key measures, such as gasoline prices and the cost of food -- the two things that most families spend a bunch of money on. But on the other hand, the extraordinary run-up of gold prices may simply be due to a bunch of speculators and gold bugs jumping in with both feet.
Takeaways?
Er, I don't know. I'm not an economist, although I stayed at a Holiday Inn Express last night.
One possible conclusion is that at least in ounces of gold, prices are pretty close to the bottom reached in 1980. Part of it, again, could simply be that gold is overvalued... but if you believe that gold is the ultimate inflation hedge, you have to think that there is some reality behind the idea that housing prices have more or less hit bottom.
But the other conclusion is that if inflation expectations are high, remain high, or become high... then gold prices will continue to rise, which means that any gains in price of housing are offset by the loss in purchasing power of the dollar. It does a seller little good to sell a house at listing price, only to end up with a bunch of cash that can't buy the same things it could a few years ago.
I don't know... but the whole thing makes me super glad that I put down a very large chunk of cash to buy my house last year.... And were I forced to sell in today's environment, I might ask for more than I thought possible, simple because the USD is losing value. On the flipside, now might not be the time to be bargain hunting as a buyer, since your cash is continuing to lose value. Unless, of course, you offer to pay in gold bullion at the closing. In which case you may end up making a golden deal or two.
Anyhow, just a quick little post while I'm working on my other one.
-rsh
![[GUEST] When the Path to Homeownership Slips into the Upside Down](/content/images/size/w600/substack-post-media-s3-amazonaws-com/public/images/b6cbe244-b076-4713-93dd-e657937ab1da_1536x1024.png)